http://www.syque.com/quality_tools/toolbook/MDAC/how.htm
Matrix Data Analysis Chart (MDAC): How to understand it
ஒரு பெரிய அளவிலான பொருட்களை ஒப்பிடும் போது, சூழ்நிலையின் சிக்கலான தன்மை, வெவ்வேறு காரணிகள் ஒன்றுக்கொன்று எவ்வாறு தொடர்புபடுகின்றன என்பதைத் தீர்மானிக்க கடினமாக இருக்கும். குறிப்பாக, ஒரே மாதிரியாக நடந்துகொள்ளும் பொருட்களின் குழுக்களைக் கண்டறிவது பயனுள்ளதாக இருக்கும். எடுத்துக்காட்டாக, அக்ரிலிக், பாலியஸ்டர், கம்பளி மற்றும் பல்வேறு ஃபைபர் கலவைகளால் செய்யப்பட்ட ஆடைகளில் 'மென்மை' மற்றும் 'கறை நீக்குதல்' ஆகியவற்றை அடைவதில் ஒரு சலவை பவுடர் வெவ்வேறு திறன்களைக் கொண்டிருக்கலாம். இழைகளின் குழுவில் இதே போன்ற பாதிப்புகள் காணப்பட்டால், தூள் பொருட்களை மாற்றுவது முழு குழுவையும் ஒரே மாதிரியாக பாதிக்கலாம்.
மேட்ரிக்ஸ் தரவு பகுப்பாய்வு விளக்கப்படம் (அல்லது MDAC ) அனைத்து பொருட்களுக்கும் பொதுவான இரண்டு முக்கிய பண்புகளை அடையாளம் கண்டு, ஒவ்வொரு உருப்படியையும் ஒரு நிலையான xy விளக்கப்படத்தில் ஒரு புள்ளியாக வரைவதன் மூலம் பொருட்களை வகைப்படுத்த உதவுகிறது. தனிப்பட்ட பொருட்கள் எவ்வாறு குணாதிசயங்களுடனும் ஒன்றுக்கொன்றும் தொடர்புபடுத்துகின்றன என்பதைப் பார்ப்பதை இது எளிதாக்குகிறது.

படம் 1. MDAC சதி
அளவிடுவதற்கான சிறந்த பண்புகளை அடையாளம் காண்பது ஒரு முக்கியமான பணியாகும், ஏனெனில் வெவ்வேறு அளவீடுகள் மிகவும் வித்தியாசமான வரைபடங்களைக் கொடுக்க முடியும். சிமென்ட் கலவைகளின் அடர்த்தி, நிறம், அமைப்பு, வலிமை போன்ற பல பண்புகளை ஒன்றாக ஒப்பிட்டுப் பார்ப்பது பயனுள்ளதாக இருக்கும், ஆனால் காகிதத்தில் கிடைக்கும் இரண்டு பரிமாணங்களால் நாம் கட்டுப்படுத்தப்படுகிறோம். பல காரணிகளை இணைப்பதற்கான கணித முறைகள் உள்ளன, ஆனால் இவை இந்த புத்தகத்தின் நோக்கத்திற்கு அப்பாற்பட்டவை.
விளக்கப்படக் குழுவில் உள்ள புள்ளிகள் எவ்வாறு ஒன்றாக அல்லது க்ளஸ்டர்களாக உருவாகின்றன என்பதைக் கருத்தில் கொள்வது MDAC பற்றிய முக்கிய விளக்கமாகும் ( இது நேரியல் போக்குகளைத் தேடும் சிதறல் வரைபடத்துடன் வேறுபடலாம் ). படம் 2 இல் உள்ளதைப் போல நேரியல் இணைப்புகளுடன் புள்ளிகளின் குறிப்பிடத்தக்க குழுக்களை முன்னிலைப்படுத்துவதன் மூலம் இந்த விளக்கம் உதவுகிறது.

படம் 1. கிளஸ்டரிங்
MDAC இல் ஆர்வமுள்ள பொதுவான உருப்படிகள் பின்வருமாறு:உருப்படிகளின் தர்க்கரீதியான குழுக்களின் நடத்தை, இது நெருக்கமான கிளஸ்டர்களை உருவாக்கும் என்று எதிர்பார்க்கப்படுகிறது. உதாரணமாக, ஒரு சலவை தூள் சோதனையில், தருக்க குழுக்கள் கம்பளி பொருட்கள், அக்ரிலிக்ஸ் மற்றும் கலவைகள் இருக்கலாம்.
விளக்கப்படத்தில் உள்ள உண்மையான கிளஸ்டரிங், இது எதிர்பார்க்கப்படும் நடத்தையிலிருந்து மாறுபாட்டைக் காட்டலாம் மற்றும் புதிய செயல்களைத் தூண்டும். எடுத்துக்காட்டாக, வெவ்வேறு ஃபைபர் வகைகளின் எதிர்பாராத கிளஸ்டரைப் பற்றிய விசாரணை, அவை ஒரே மாதிரியான விவரக்குறிப்புகளுடன் வெவ்வேறு இழைகளை வழங்குவதற்கான செயல்முறைகளை உருவாக்கிய ஒரு உற்பத்தியாளரிடமிருந்து வந்தவை என்பதைக் காட்டலாம்.
When comparing a large set of items, the complexity of the situation can make it difficult to determine how different factors relate to one another. In particular, it can be useful to find groups of items that behave in similar ways. For example, a washing powder may have different efficiencies at achieving 'softness' and 'stain removal' in garments made of acrylic, polyester, wool and various fiber mixtures. If similar affects are found in a group of fibers, then changing the powder ingredients may affect the whole group in a similar way.
The Matrix Data Analysis Chart (or MDAC) helps classify items by identifying two major characteristics common to all items and then plotting each item as a point on a standard x-y chart. This makes it easier to see how the individual items relate both to the characteristics and to one another, thus:
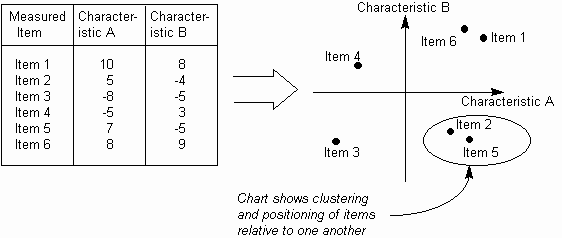
Fig. 1. MDAC plot
Identifying the best characteristics to measure is an important task, as different sets of measurements can give very different charts. It would be useful to be able to compare many characteristics together, such as the density, color, texture, strength, etc. of cement mixtures, but we are constrained by the two dimensions available on paper. There are mathematical methods for combining multiple factors, but these are beyond the scope of this book.
A key interpretation point about an MDAC is to consider how points on the chart group together or form into clusters (this may be contrasted with the Scatter Diagram, which looks for linear trends). This interpretation is helped by highlighting significant groups of points with linear links, as in Fig. 2.
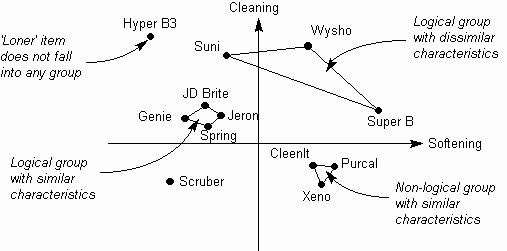
Fig. 1. Clustering
Typical items of interest on an MDAC include:
The behavior of logical groups of items, which might be expected to form close clusters. For example, in a washing powder test, logical groups might be woolen items, acrylics and mixtures.
Actual clustering on the chart which might highlight divergence from expected behavior, and prompt new actions. For example, investigation of an unexpected cluster of different fiber types might show that they come from one manufacturer who has developed processes to give different fibers with similar specifications.
No comments:
Post a Comment